The Choice is not just between Flood Levees and Flood Levies (email sent 31/1/11)
Steven Molino,
Molino Stewart
Re: ‘Levees a better long-term solution than levies’, The Australian, 31/1/11
Your article suggested that flood-plain management (eg by constructing flood levees) would be preferable to periodically facing large flood damage restoration costs (and perhaps having to increase taxes to do so). Your article also noted that Queensland has done relatively little in flood-plain management.
I would like to suggest that another issue related to flood management in Queensland that needs attention could be that, for reasons suggested below, the 100 year flood level that has been the basis for approving property development adjacent to the river in Brisbane and Ipswich is too low. Moreover, there are now serious difficulties in ensuring that governments act on reliable advice.
I would be interested in your response to my speculations.
John Craig
Outline of Concerns about 100 Year Flood Level Assumptions for Brisbane
The 100 year Brisbane River flood (which is used as the basis for defining flood levels in approving property development) is apparently 6,000 cubic metres / second corresponding to a flood height on the Port Office / City gauge of 3.3m, estimates that seem to be based on Review of Brisbane River Flood Study, 2003 (see p21).
As I understand it also:
- There has been controversy about whether this is appropriate (eg see Thomas H., Incorrect measure put homes in danger zone, The Australian, 21/1/11). The latter pointed to differences between the 2003 review report and a 1999 report (Brisbane River Flood Study). The latter had suggested that the 1 in 100 year flood that should be assumed as the basis for property development should be 8,600 cubic metres / second, which would be over 1 metre higher at the Port Office / City gauge (p10), and up to about 3m higher than the presently assumed 1 in 100 year flood level further upstream;
- Estimating appropriate flood heights for development approval is complex. For example, changes to the Brisbane River (eg removal of a sand bar and dredging at the river mouth; and construction of Somerset and Wivenhoe Dams with flood storage capacity) would reduce the levels associated with historical floods. Also there are different methods for estimating floods (eg those based on observed historical flood levels from which flow volumes can be imputed; or those based on modelling the effect of expected rainfall to calculate possible flood volumes, and then using this to estimate flood levels);
- Observed flood events in the 19th century appear significantly greater than those over the past century – noting that the 1893 and 1841 floods reportedly reached over 8m on the Port Office / City gauge and the associated river flows (after allowing for removal of sand bar and dredging) may have been over 14,000 cub metres / second (Brisbane River Flood Study, 1999, p3). Two such flood events in 200 years suggests that the 1 in 100 year flood (if the effect of dams is ignored) might be something over 14,000 cubic metres / second. This can be compared with the 1974 (pre-Wivenhoe Dam) flood involved a peak flow of about 9,500 cubic metres / second (associated with a flood height on the Port Office / City gauge of 5.45m), and the corresponding 2011 (post Wivenhoe Dam) figures of perhaps 9,000 cubic metres / sec (associated with peak a Port Office / City gauge height of 4.45m);
Note Added Later: "Greg McMahon, a consultant who was the chief flood expert in Queensland's local government department until the early 1990s, says attitudes to dam safety became compromised during the late 1980s when "political skulduggery" led to an effective lowering of standards. He explains that when Wivenhoe was first conceived in the 1970s, Australian design standards for large dams made of earth and rock required them to be able to contain the flood created by the largest possible rain event in the catchment, the "probable maximum precipitation". But soon after Wivenhoe was completed in 1984, meteorologists realised they had significantly underestimated the size of this epic deluge." [1]
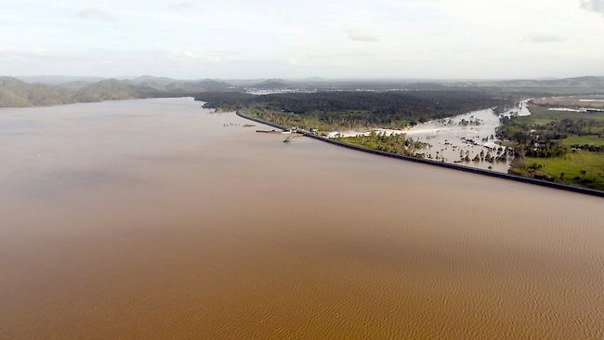
- The dams on the Brisbane River (which provide flood storages for 50% of the catchments feeding into the Brisbane River) seem to be officially assumed to reduce 100 year peak floods by 50% (Review of Brisbane River Flood Study, 2003, p18) – ie from a likely 12,000 cubic metres / second to 6,000 cubic metres / second. However, in 2011 the flood almost overwhelmed Wivenhoe Dam’s capacity to cope with the event without damage to the Dam itself [see photograph below]. It is noted that the dam had been at full supply level prior to the flood and that the 1999 Brisbane River Flood Study had suggested that that this would be normal for dams that are about to encounter major floods. Moreover in both 1974 and 2011, the dominant influence on peak flows at Ipswich and Brisbane apparently came from the Bremer River – rather than from the catchments which gained flood protection from Wivenhoe and Somerset Dams;
Wivenhoe Dam with not much to spare - January 2011
- The levels officially assumed to be appropriate for a 1 in 100 year flood may be much too low, because they seem to discount events in the 19th century. The 1999 Brisbane River Flood Study was based on historic flood levels (and suggested allowing for 8,600 cubic metres / second floods). However the 2003 Review of Brisbane River Flood Study (which is the basis for official 6,000 cubic metre / second flood estimates) appears to derive flood levels primarily from modelling the effect of an assumed distribution of rainfall events. The problem with this is that rainfall data is likely to be biased towards 20th century events (because earlier rainfall record keeping was much less reliable and extensive). The assumed rainfall events are thus potentially inadequate (ie don’t allow sufficiently for extreme rainfall events). Extreme floods (such as those in 1841 and 1893) were presumably associated with equally extreme rainfall events but these may not have been adequately included in official rainfall records. The review report noted that flood estimates based on rainfall data were lower than those based on historical flood data (p14), but seemed none-the-less to use assumed rainfall distributions as the basis for calculating 1 in 100 year flood events. Though this allowed analysts to perform all sorts of sophisticated computer simulations, if the basic data was wrong those simulations would be a case of ‘garbage in, garbage out’. Finally it can be noted that, if the 1 in 100 year flood volume is actually significantly greater than is being officially assumed, then the flood storage in Wivenhoe and Somerset Dams could be overwhelmed, so that the hoped-for 50% reduction in 1 in 100 year flood volumes might not be achieved.
Notes added later:
Wivenhoe Flood Storage Capacity
The flood storage capacity of Wivenhoe Dam was reduced by about 20% (ie by 250,000 megalitres to 1.2m megalitres) in order to improve its safety. Dam operators had been warned that the dam could be over-topped by an extreme rainfall event with a return period of 5000 years. The upgrade to reduce this risk involved building three 'fuse plugs' to collapse and release water if levels reached 75.7m (below the dams 77m at which the dam's 1.45m megalitre flood storage capacity was initially estimated). Flood capacity is further reduced because operators seek to keep water levels below 75m [1]
Effect of Extreme Rainfall Events on Wivenhoe Dam (email sent 5/2/11)
Hedley Thomas
Re: Cheap Wivenhoe Dam upgrade reduced its capacity, The Australian, 5/2/11
Your article suggested that an upgrade to protect Wivenhoe Dam was designed to provide safety protection against a 1 in 5000 year rainfall event. However there seems to be some reason to suspect that the assumptions about rainfall events in the Wivenhoe catchment may be somewhat too low (see The Choice is not just between Flood Levees and Flood Levies). Rainfall estimates seem to produce flood projections that are lower than those based on historical flood records, perhaps because the former are biased towards data collected in the 20th century when conditions were relatively mild (ie not characterised by more extreme flood events).
Also it is noted that the 2011 flood (anything but a 1 in 5000 year event) seemed to give Wivenhoe Dam’s operators a challenge in maintaining the integrity of dam. The probably implication is that the full supply level for Wivenhoe Dam may not be able to be safely assumed in future to be RL 67 – but may need to be several metres lower. If so, this would significantly reduce the Dam’s already-suspect capacity to provide reliable water supplies for SE Queensland.
John Craig
Related notes:
- Blacked out section of Wivenhoe Dan operating manual showed that its storage capacity may have been reduced to 0.996m megalitres - as operators start releasing water when level reaches 74.5 to protect fuse plugs [1]
- 0.29m megalitres are to be released (in February 2011) from Wivenhoe Dam because of the risk of further heavy rain. This will reduce its originally planned 1.15m megalitre water storage capacity [1]. [This tends to confirm the Hedley Thomas' suggestion that the flood storage that can be provided by Wivenhoe Dam (and thus its ability to safely provide water supplies to SE Queensland) has been reduced significantly by the installation of safety measures to guard against a 5000 year flood event. However this reduction may not be sufficient if the rainfall data that is the basis of estimating such an event is inaccurate (see above)
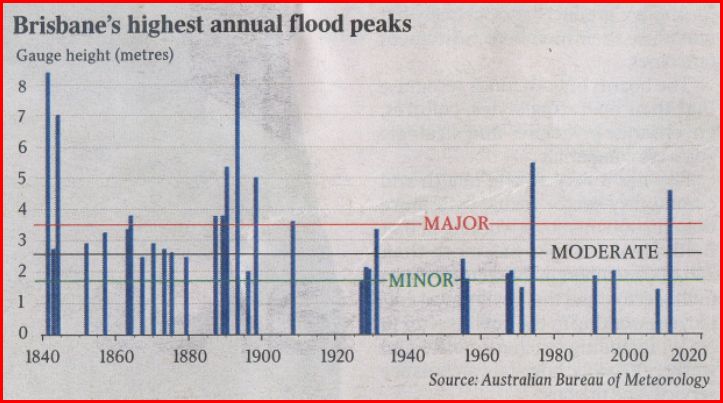
Historical Flood Data in 19th and 20th Centuries
The diagram reproduced below appeared in Main A., 'Premiums set to rise, naturally', The Australian Wealth, 9/2/11
By way of background I note that (though a civil engineer by initial qualification) I have only an amateur interest in hydrology – based on: (a) abandoning a canoe trip down the Brisbane River as the 1974 flood rose, and later 'helping' dispose of beer in a flooded riverside club; (b) informally ‘calling on the army’ to help in the 1974 clean-up (as the off-sider to the Coordinator General who then headed the State Disaster Control Organisation); (c) living at Wivenhoe Dam site while working for SMEC on the Wivenhoe Power Station; and (d) attempting to identify the structural causes of manifest ineptitude in Queensland’s water supply management (see Structural Incompetence and SE Queensland's Water Crisis).
In relation to the latter it is further noted that there are increasing difficulties in ensuring that reliable advice is given to governments. For example: (a) for the last 2-3 decades governments have clearly favoured getting advice from tame experts who tell then what they want to hear – eg by politicisation of public services (see Decay of Australian Public Administration); (b) increased private sector control over the provision of public goods and services has left governments more exposed to commercially self-interested advice; and (c) there seem to be instances (in transport planning) where conflicts of interest have compromised what should be purely technical advice (see A Conflict of Interest?). Moreover there are reasons to suspect that seeking advice from sources likely to justify low assumptions about 100 year flood levels might be politically advantageous (eg eg in terms of: (a) the effect on the value of assets held by property developers with political connections; and (b) the effect on ‘climate change’ agendas, if weather events in the past were seen to be more extreme than those that are now occurring).
Economy for a New Climate (email sent 2/2/11)
Rob Burgess
BusinessSpectator
Re: The climate for a new economy, BusinessSpectator, 2/2/11
Your article suggested, partly on the basis of comments by Ian Goodwin (Macquarie University), that climate change requires Australia to develop a new style of economy. However, the issue is more complex than this
For example the estimated storm surge associated with the Category 5 Cyclone Yasi is currently about 7 m (at 5PM on Wednesday 2 February, up from 2m on Tuesday night and 4m on Wednesday morning). However the Bathurst Bay storm surge associated with the Category 5 Cyclone Mahina in 1899 was reportedly 13m. The 1899 surge may have been higher at Bathurst Bay than in adjacent coastal areas because of funnelling effects. However there seems little doubt that Cyclone Yasi is not unprecedented in its intensity and effects. The perception that current weather events are unusually extreme seems, at least in part, to reflect a loss of memory about events in the 19th century, because conditions in the 20th century were relatively mild. The same may apply to flooding, as floods in the Brisbane River in 1841 and 1893 seem to have been much worse than those in recent decades – see The Choice is not just between Flood Levees and Flood Levies [and added diagram in particular].
[Note added later: It was reported that Cyclone Yasi (which slowed and thus did not cross the coast at high tide as had been feared) actually produced a 2m storm surge [1] ]
John Craig